


The Mass Production Yield Trap After DDR5 SI Sign-off: Using DFQ to Predict Defect Rates Early
-
 2026.05.07
Intro: Traditional Signal Integrity (SI) simulation only verifies performance under nominal parameters, failing to reflect the impact of mass production process fluctuations on yield. This article introduces how DFQ (Design for Quality) quantifies mass production defect rates during the DDR5 Sign-off phase through DOE + RSM + Monte Carlo analysis, helping engineers lock in yield risks early during the decision-making phase.
I. A Meeting Without a Standard Answer
Imagine you are the SI engineer for a DDR5 design team, and today you must make the final choice between two routing schemes.
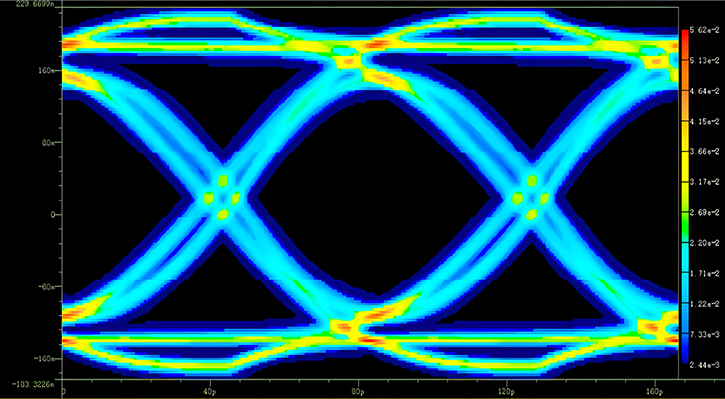
The simulation results are as follows:

Both schemes pass the specifications, but Scheme 1 clearly has a larger margin. Instinctively, an SI engineer would choose Scheme 1 as the "safer" bet.
After a few seconds of silence, the Product Manager asks a single question: "Under what conditions was this margin simulated?" This question pierces right through the blind spot of traditional SI simulation.
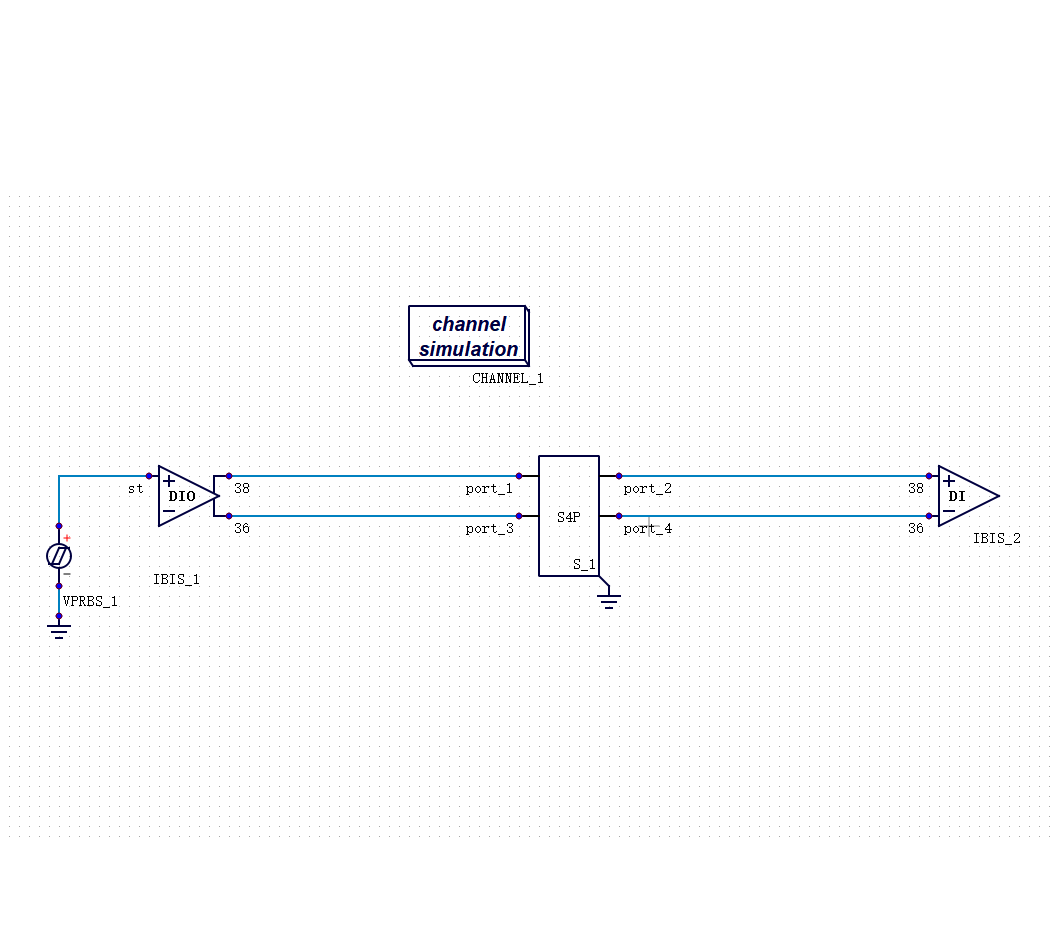
II. Simulation Pass ≠ Mass Production Standard
Most SI simulations run by default on a fixed set of parameters: nominal impedance, typical via models, and "Typ" corner IBIS models. While this is a reasonable simplification, it only answers one question: Can this design work under ideal conditions?
A Product Manager, however, wants to know: Out of every 100 boards produced, how many will fail? These are not the same thing.
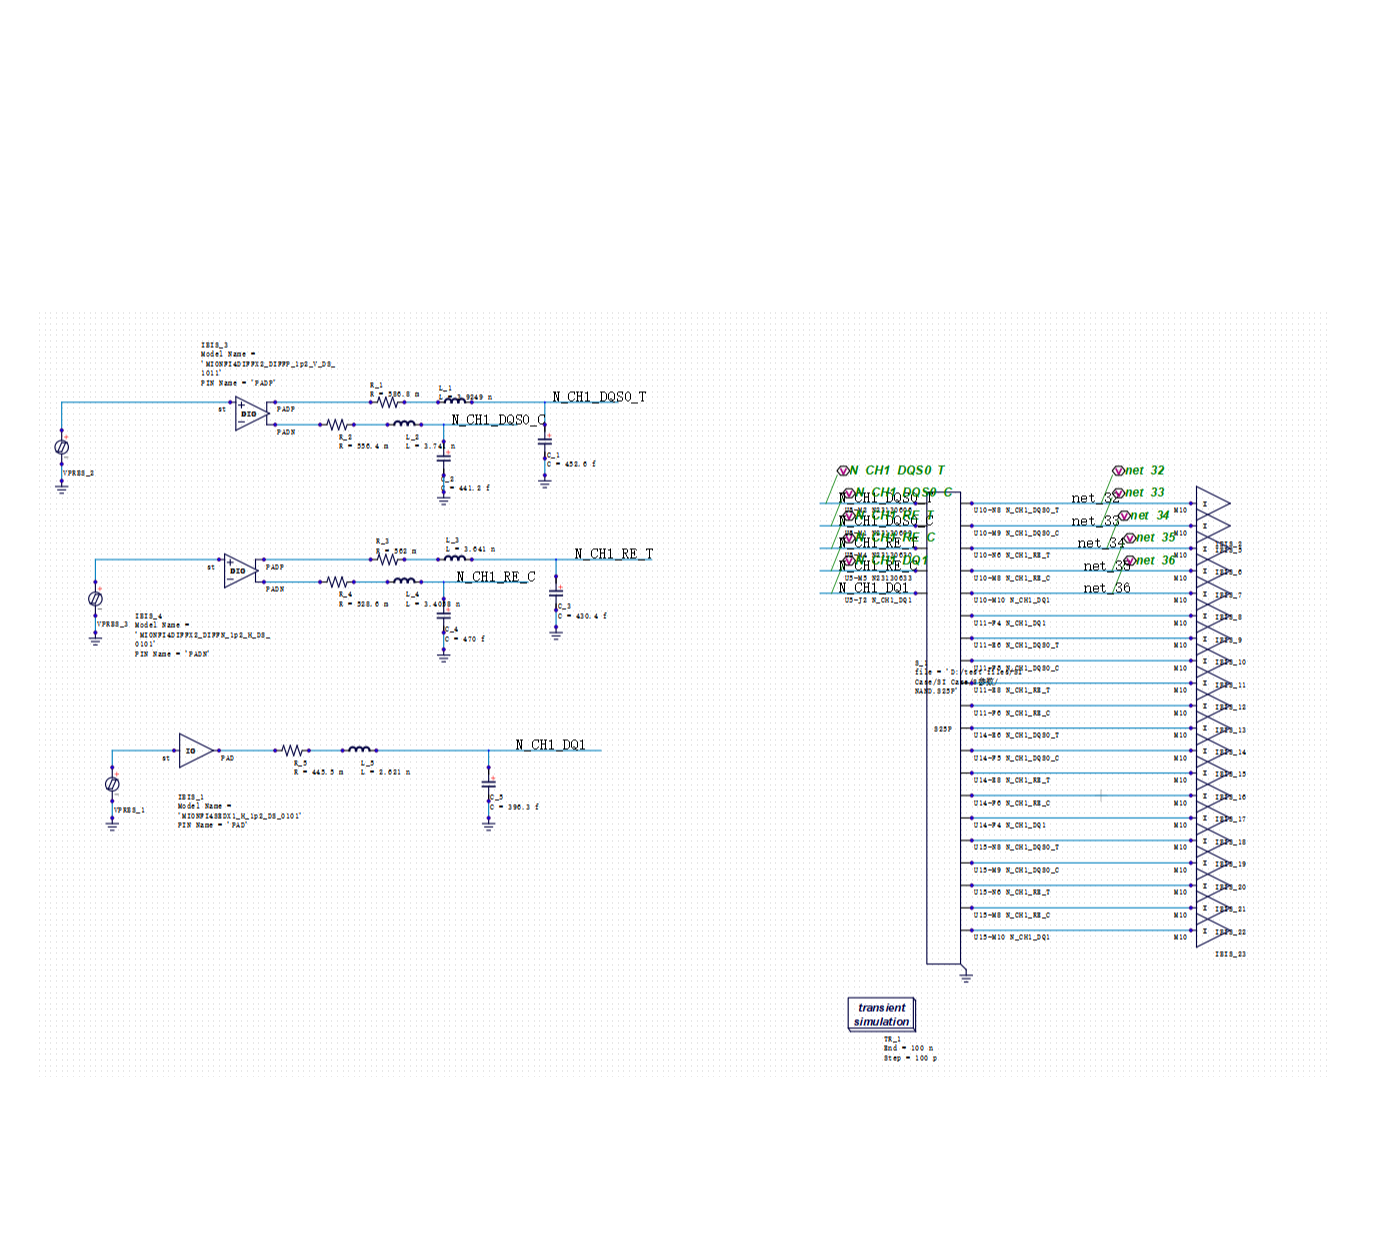
In actual production, the parameters of every board fluctuate randomly within tolerance ranges:
PCB Impedance: Tolerance of ±10%.
Drive Strength: Fluctuates with process corners.
Via Dimensions: Subject to manufacturing errors.
The single set of parameters used in a traditional simulation is merely one point in a vast distribution space. Traditional SI simulation tells you if that specific point is qualified, but it doesn't tell you how many points in the entire distribution will fail. This blind spot remains hidden during the design phase but manifests as real yield loss during mass production.

III. DFQ: Introducing Yield into Simulation Decisions
The core of DFQ (Design for Quality) is to incorporate the parameter distribution of the production process directly into the simulation phase. The DFQ function in SIDesigner is based on three steps:
1、DOE (Design of Experiments): Instead of running a single set of parameters, the system systematically scans key variables affecting SI performance. In DDR design, these usually include $VDDQ$ voltage, CPU-side $ODT$ impedance, DRAM-side $ODT$ impedance, and PCB trace impedance. DOE constructs an experimental matrix that explores the maximum parameter range with the minimum number of simulations.
2、RSM (Response Surface Modeling): Based on the DOE results, a mathematical model is fitted to quickly predict performance metrics (Eye Height, Eye Width, BER) for any parameter combination. This significantly reduces computational costs as subsequent analyses do not require point-by-point simulation.
3、Monte Carlo Predicting Defect Rates: By substituting the error distribution (mean + tolerance) of mass production parameters into the RSM model, Monte Carlo analysis predicts what percentage of products will fall outside the spec under real production conditions. This percentage is the predicted defect rate.
IV. Comparing the Two Schemes via DFQ
Returning to our opening scenario, notice how the perspective shifts after introducing DFQ analysis:

While Scheme 1 has a larger eye margin, its defect rate is nearly double that of Scheme 2 when accounting for production fluctuations.
What does 13.8% mean? It means for every 100 boards produced, nearly 14 will fall outside the spec, facing rework or scrapping. For mass-produced products, this gap translates directly into yield costs. While the SI engineer looks at simulation margins, the Product Manager looks at production yield. DFQ folds these two perspectives into a single basis for decision-making.
V. When is DFQ Necessary?
While not every design requires DFQ, it is essential in the following scenarios:
Multi-scheme Selection: When eye diagrams are close and margins alone are insufficient for a decision.
Yield Failure Analysis: When production yield is lower than expected and the design root cause needs to be identified.
Design Reviews for Mass Production: Moving beyond "will it work" to predicting mass production performance.
Parameter Sensitivity Ranking: Identifying which variables impact yield the most to prioritize optimization.
VI. Conclusion
The gap between a "simulation pass" and "mass production standard" is filled by parameter distribution, process tolerances, and probability.
A truly good design doesn't just work under ideal conditions; it remains stable across a real-world distribution. The value of DFQ lies in measuring this distance during the design phase, allowing decisions to be based on hard data rather than intuition or experience.
If your project faces similar scheme selection or yield challenges, feel free to book a SIDesigner demo to see the full application of DFQ in real DDR/HBM designs.


Recommended
-
 Optimizing DDR Signal Integrity: Using DFQ Sensitivity Analysis (S1/ST) to Identify High-Leverage Design Variables
 2026.06.10
 -
 Efficiency Bottleneck in DDR5 Multi-Corner Timing Verification: PDA Analysis Methods
2026.05.27
Efficiency Bottleneck in DDR5 Multi-Corner Timing Verification: PDA Analysis Methods
2026.05.27 -
 The Mass Production Yield Trap After DDR5 SI Sign-off: Using DFQ to Predict Defect Rates Early
2026.05.07
The Mass Production Yield Trap After DDR5 SI Sign-off: Using DFQ to Predict Defect Rates Early
2026.05.07 -
 Selecting SI Simulation Tools: Practical Verification of SIDesigner's 4 Core Capabilities
2026.04.29
Selecting SI Simulation Tools: Practical Verification of SIDesigner's 4 Core Capabilities
2026.04.29